Have you ever noticed how difficult it can be to find the right level for bass frequencies in a mix? Or how our perception of this changes with monitoring level? Why is this so much harder for us than it is for relatively high frequencies? Part of the issue can be associated with monitoring systems and acoustics, but there is another critical factor at play: psychoacoustics, or how the human ear perceives sound. Having a bit of knowledge about how our auditory system works can really help you as a mix engineer since every decision we make is impacted by our perception of sound.
Everyone hears sound a little differently. One way we measure an individual's hearing is with a test called an audiogram. During an audiogram, test tones at various frequencies are played at different levels and the person being tested indicates whether they can hear the tone or not. Although the results will vary slightly from person to person, over the course of many studies we have been able to plot an average curve that describes all of us in a general way.
At best, we can hear frequencies between 20 Hz and 20 kHz but within this range we don’t perceive all frequencies as being equally loud. In general, we're more sensitive to upper midrange frequencies, with the highest sensitivity being in the 2kHz-4kHz range. This frequency response curve also changes depending on the overall amplitude level of the sound; at higher amplitudes we perceive frequencies more equivalently than at lower amplitudes.
 The way our ear works affects the way we perceive the music we produce and listen to.
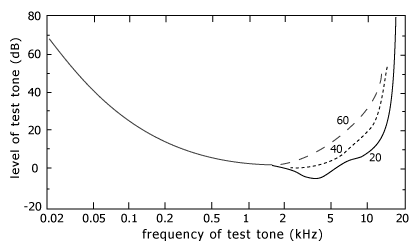
In general, we are not very sensitive to low frequencies. In the above graph this is visualized as a steep slope between 20 and 50 Hz. Frequencies in this range need to be much louder than higher frequencies in order to be perceived as being the same loudness.
We can also see that the frequencies we are most sensitive to fall somewhere between 2 and 4 kHz. This particular range corresponds to the resonance of our auditory canal. This may have come about as an evolutionary development as this is an important frequency range for stimulus such as human speech, the cry of a baby or the sound of a sabre-toothed tiger stalking you from the shadows.
How we perceive the highest frequencies changes as we age. Due to the design of our inner ear, we tend to lose high frequency sensitivity as we get older. The graph above indicates this as well, displaying data for ages of 20, 40 and 60 as alternative high frequency curves.
What makes things really interesting is that the frequency response of our auditory system also differs depending on amplitude. The following graph shows a similar set of curves to the last graph, but with multiple curves. These are called Equal Loudness Contours.
The way our ear works affects the way we perceive the music we produce and listen to.
In general, we are not very sensitive to low frequencies. In the above graph this is visualized as a steep slope between 20 and 50 Hz. Frequencies in this range need to be much louder than higher frequencies in order to be perceived as being the same loudness.
We can also see that the frequencies we are most sensitive to fall somewhere between 2 and 4 kHz. This particular range corresponds to the resonance of our auditory canal. This may have come about as an evolutionary development as this is an important frequency range for stimulus such as human speech, the cry of a baby or the sound of a sabre-toothed tiger stalking you from the shadows.
How we perceive the highest frequencies changes as we age. Due to the design of our inner ear, we tend to lose high frequency sensitivity as we get older. The graph above indicates this as well, displaying data for ages of 20, 40 and 60 as alternative high frequency curves.
What makes things really interesting is that the frequency response of our auditory system also differs depending on amplitude. The following graph shows a similar set of curves to the last graph, but with multiple curves. These are called Equal Loudness Contours.
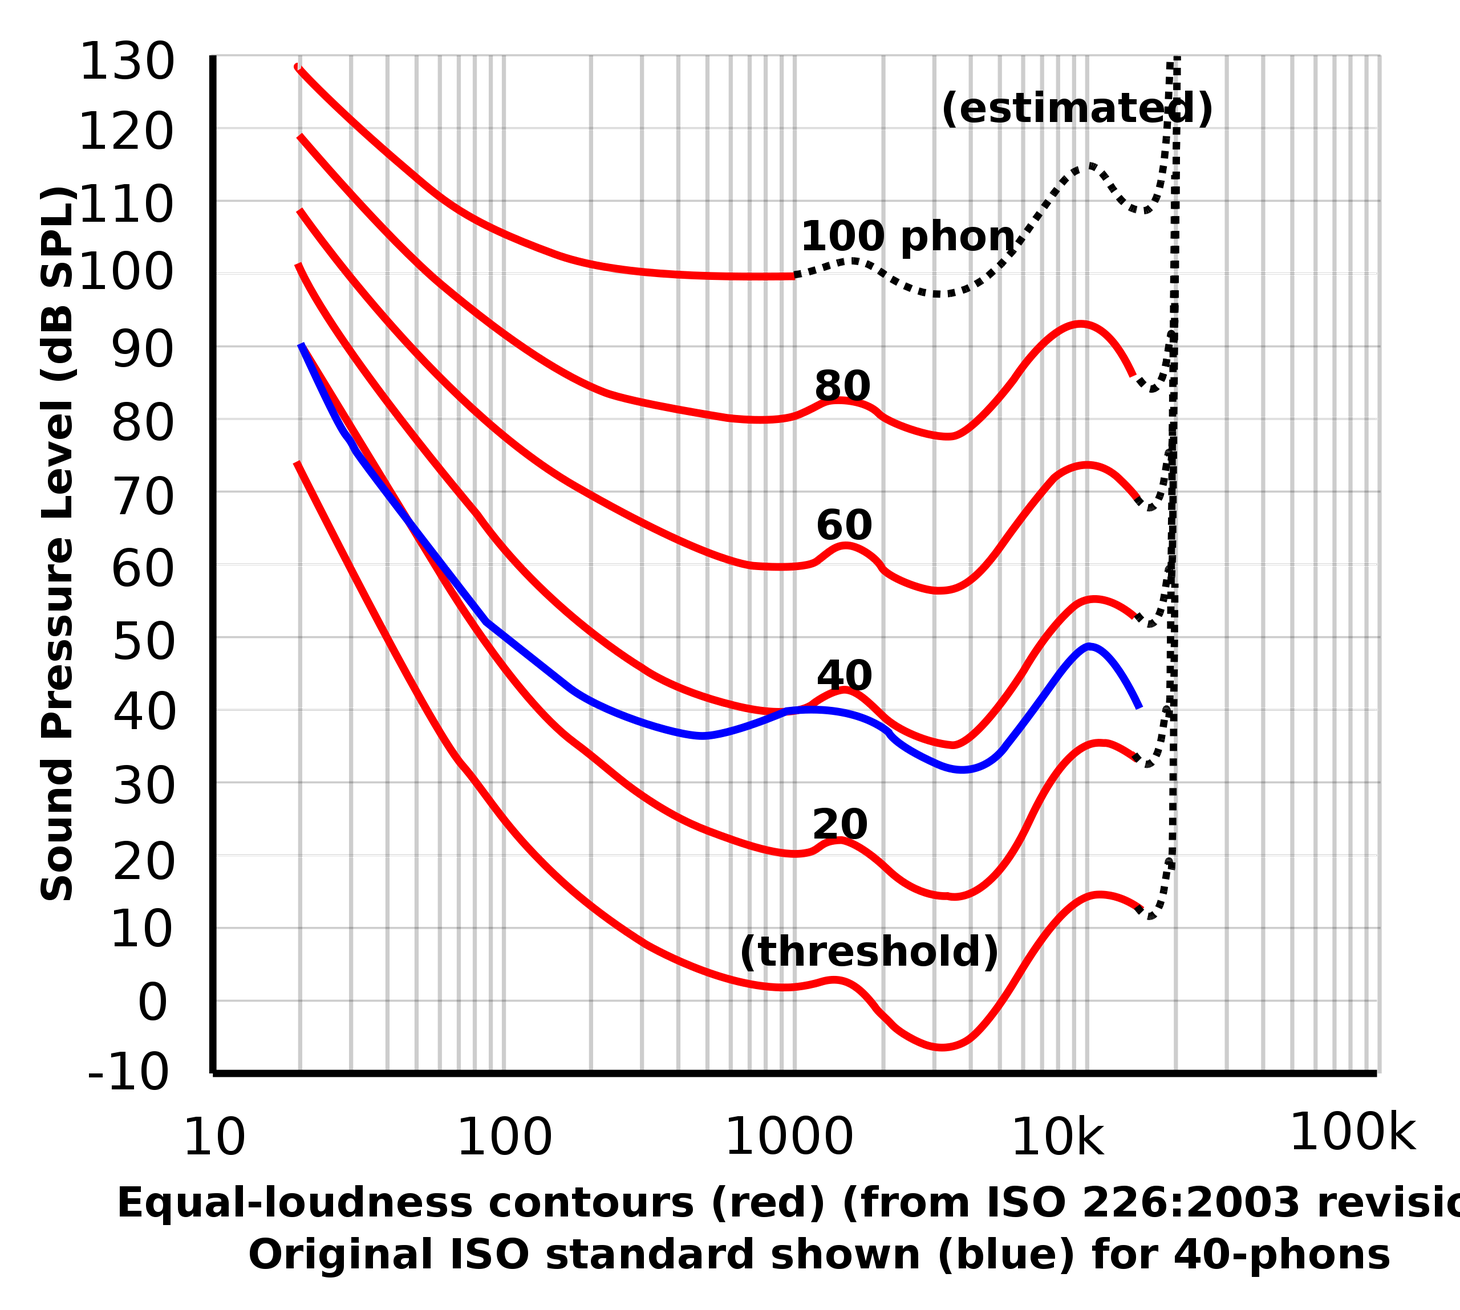 Equal Loudness Contours. All frequencies along a given line (red or blue), will be perceived as equivalently loud.
This graph, like the previous one, shows that we are much less sensitive to low frequencies than high frequencies. However, it also reveals that as things get louder this difference becomes less pronounced.
This sheds some light on why we tend to subliminally favour loud music; we perceive more spectral information when things get loud, particularly in the bass department. This is also the reason you might see a 'loudness' button on some home stereo units. This feature is meant to be used when listening at low volumes and adds high and low frequency emphasis to compensate for our lack of sensitivity at low levels in these areas.
These graphs can help inform some best practices for monitoring a mix. It is common practice in a professional studio to establish preset listening levels for monitoring, often in the 76-84 dB range. In a perfect world, we would monitor at even louder levels because our ears would have the flattest frequency response. However, too much time spent listening at loud levels results in hearing damage over time. For this reason we need to find a sweet spot; loud enough for the ear to trend towards a flat curve, but quiet enough so we can work in this environment day after day. Additionally, consistently monitoring at the same level allows us to evaluate the overall spectrum of our mix. As an example, we can't accurately evaluate whether a mix has the right amount of low end if we are constantly changing the monitoring level and thus altering how sensitive we are to those frequencies.
Equal Loudness Contours. All frequencies along a given line (red or blue), will be perceived as equivalently loud.
This graph, like the previous one, shows that we are much less sensitive to low frequencies than high frequencies. However, it also reveals that as things get louder this difference becomes less pronounced.
This sheds some light on why we tend to subliminally favour loud music; we perceive more spectral information when things get loud, particularly in the bass department. This is also the reason you might see a 'loudness' button on some home stereo units. This feature is meant to be used when listening at low volumes and adds high and low frequency emphasis to compensate for our lack of sensitivity at low levels in these areas.
These graphs can help inform some best practices for monitoring a mix. It is common practice in a professional studio to establish preset listening levels for monitoring, often in the 76-84 dB range. In a perfect world, we would monitor at even louder levels because our ears would have the flattest frequency response. However, too much time spent listening at loud levels results in hearing damage over time. For this reason we need to find a sweet spot; loud enough for the ear to trend towards a flat curve, but quiet enough so we can work in this environment day after day. Additionally, consistently monitoring at the same level allows us to evaluate the overall spectrum of our mix. As an example, we can't accurately evaluate whether a mix has the right amount of low end if we are constantly changing the monitoring level and thus altering how sensitive we are to those frequencies.
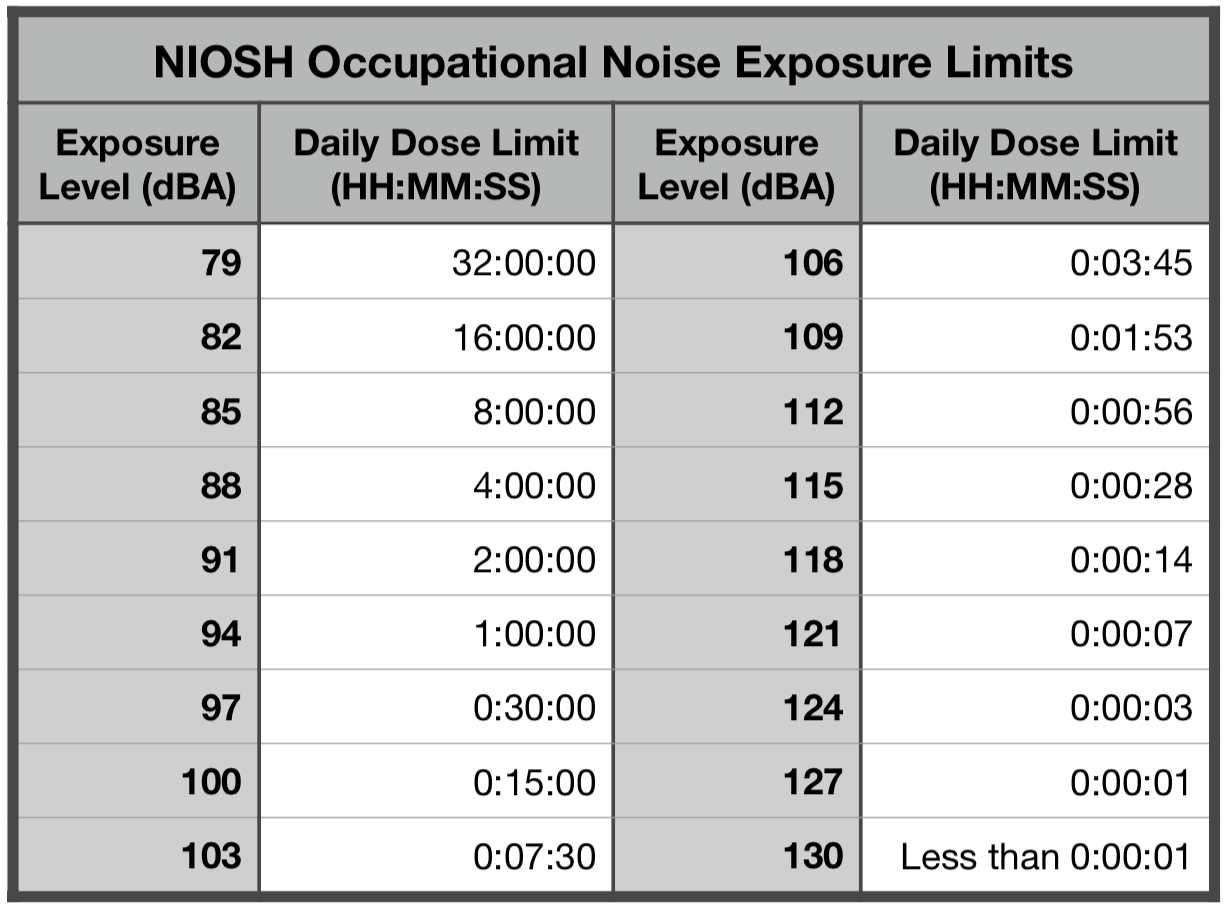 The National Institute for Occupational Safety and Health (NIOSH) states that 8 hours of exposure at 85 dBA constitutes the acceptable limit for sound in a day. Above this amount, exposure is considered hazardous. Note that as the sound pressure level increases, the acceptable exposure time decreases. The relationship is that for every 3 dBA increase, the acceptable exposure time halves. So at 88 dBA, it would only take 4 hours to reach the permissible daily dose. More information can be found at the Centers for Disease Control and Prevention's Website (https://www.cdc.gov/niosh/pubs/default.html)
 When you’re mixing, understanding these concepts i.e how we perceive frequencies and loudness is important for a couple of reasons: